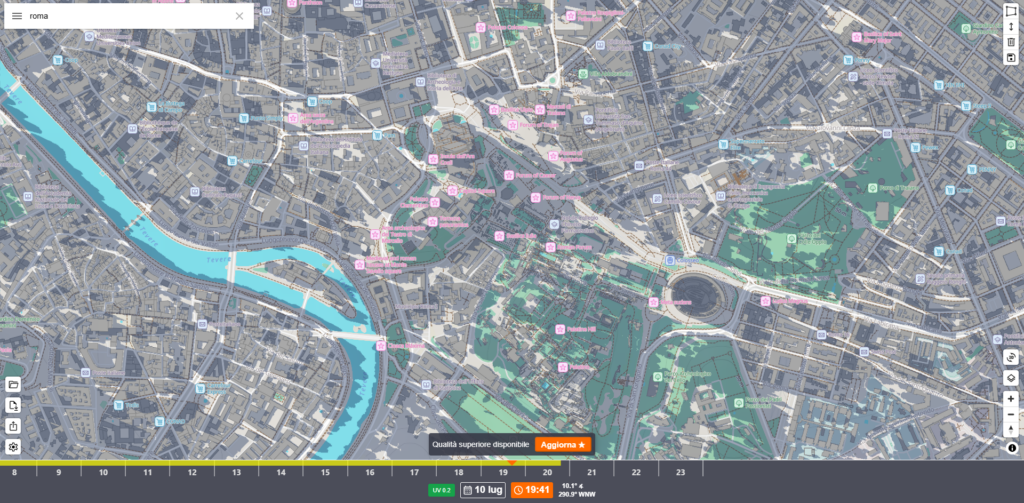
Finding a parking spot where you won’t come back to a scorching-hot car, choosing the right side of the street for a walk, figuring out what time a table on a sidewalk will still be cool. These are the most common uses of ShadeMap, the digital platform that has gone viral on Instagram and TikTok in recent weeks, thanks to the record-breaking heat wave that has swept across Italy. The tool, which is free in its basic version, overlays traditional maps with a dynamic layer that shows where direct sunlight falls and where shade extends—anywhere on the planet and for any date and time.
A tool originally designed for an entirely different purpose
The creator of ShapeMap, computer engineer Ted Piotrowski, of Bothell, Washington, had originally developed the app as a geospatial analysis tool to verify times and locations based on the direction of shadows in photos and videos—a feature still used today in investigative and journalistic contexts.
The shift toward widespread use came during the peak of the heatwave: according to data released by the Copernicus Climate Change Service, June 2026 was the hottest month ever recorded in Western Europe, with an average temperature of 20.74 degrees—3.05 degrees above the 1991–2020 average—a figure that surpassed the previous record set in 2025. The second half of the month was marked by a heat wave that set new daily records in several countries, in some cases the highest on record since records began.
How it works
The mechanism is based on a simple principle applied on a massive scale: for each pixel on the map, the system calculates the astronomical position of the sun at that precise moment, then checks whether an obstacle—a building, a hill, or, where data allows, vegetation—blocks the ray. If it blocks the ray, that point appears in shadow; if the ray reaches the ground unobstructed, the area is marked as sunny. The calculation runs in real time in the browser using WebGL, with no installation required.
What the map shows—and what it doesn’t
This tool is not a weather service: it processes only solar geometry and physical obstacles. The stated accuracy is within three meters, but it depends on the quality of the mapping data and building information available for each area, and the vegetation modeling may not reflect recently planted or felled trees. For this reason, the manufacturer itself recommends not using it as definitive evidence in legal or investigative contexts, but rather as a visual aid that should always be identified as a simulation.
The free version provides basic viewing capabilities; the paid version offers higher resolution and advanced modeling tools, designed for professional use rather than recreational use.
Urban Green Spaces Wanted
A comparison between Italian shade maps and those of cities in Northern Europe reveals a problem that is more structural than simply summer heat. Where there are large parks and tree-lined avenues, shade is distributed widely and continuously. In Italian historic centers with little urban greenery, this often means that the only shelter available is that provided by building facades.